The Trader Harbor
  • Business
  • Politics
  • World News
  • Stocks
  • Business
  • Politics
  • World News
  • Stocks

The Trader Harbor

Stocks

Lagging Mid-cap ETF Hits Moment of Truth

by admin June 23, 2025
June 23, 2025
Lagging Mid-cap ETF Hits Moment of Truth

The S&P MidCap 400 SPDR (MDY) is trading at a moment of truth as its 5-day SMA returns to the 200-day SMA. A bearish trend signal triggered in early March. Despite a strong bounce from early April to mid May, this signal remains in force because it has yet to be proven otherwise. Today’s report will show how to quantify signals and reduce whipsaws using the percentage difference between two SMAs.

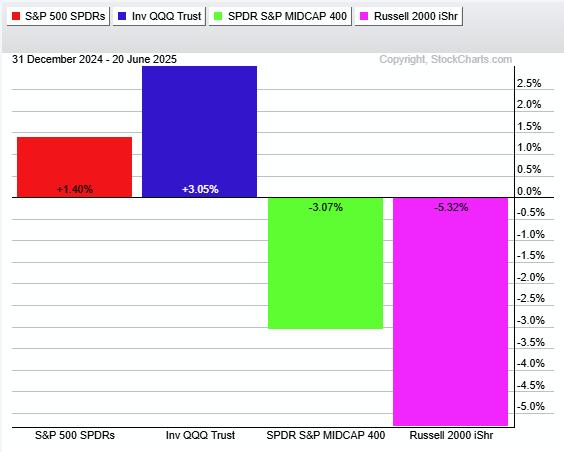
First note that MDY is lagging SPY and QQQ because its 5-day has yet to cross above its 200-day. The latter two saw bullish crosses in mid May, over a month ago. A bullish breakout in MDY would reflect broadening upside participation, which would be bullish for stocks. The PerfChart below shows SPY and QQQ with year-to-date gains. MDY and IWM are down year-to-date. 


***********************

TrendInvestorPro continues to follow the leading uptrends and recent breakouts in metals-related ETFs. These include gold, silver, palladium, platinum, copper and associated miners. Tech-related ETFs are also leading and featured in our reports/videos. Click here to learn more and get full access to our research.

***********************

The chart below shows MDY hitting its moment of truth as the 5-day SMA (black line) bumps against the underside of the 200-day SMA (blue line). A bearish cross occurred in late February and this signal has yet to be reversed. However, I am not watching for a simple 5/200 cross. Instead, I want to see the 5-day SMA clear the 200-day SMA by a certain percentage. This is a signal threshold.

The indicator window shows Percent above MA (5,200,1), which measures the percentage difference between the 5 and 200 day SMAs. See the TIP Indicator Edge Plugin for details. I placed signal thresholds at +3% and -3% to reduce whipsaws. A bullish signal triggers with a move above +3% and a bearish signal triggers with a move below -3%. At the very least, this indicator value is still negative and bearish. A move above 0 would reflect a positive 5/200 cross, while a move above +3% would trigger a bullish trend signal. This indicator is part of the TIP Indicator Edge Plugin for StockCharts ACP.

The signal threshold levels depend on your personal preferences and trading styles. Tighter thresholds generate earlier signals, but with more whipsaws. Wider thresholds reduce whipsaws, but increase signal lag. This is always the tradeoff. I prefer plus/minus 1 percent when using the 5/200 cross for SPY. I widened these thresholds to plus/minus 3 percent for MDY because it is more volatile.

TrendInvestorPro continues to follow the leading uptrends and recent breakouts in metals-related ETFs. These include gold, silver, palladium, platinum, copper and associated miners. Tech-related ETFs are also leading and featured in our reports/videos. Click here to learn more and gain immediate access. 

0
FacebookTwitterGoogle +Pinterest
previous post
Inside the Situation Room, where Trump and his national security team monitored ‘spectacular’ success on Iran
next post
3 S&P 500 Charts That Point to the Next Big Move

Related Posts

Major Shift in the Markets! Here’s Where the...

June 17, 2025

What the S&P 500, VIX, and ARKK are...

June 13, 2025

What Does a Market Top Look Like?

July 20, 2024

Spot The Warning Signs of Bankruptcy!

March 16, 2024

Navigating Earnings: Three Stocks, Three Different Stories

May 13, 2025

Will the S&P 500 Break 5000 by September?

July 27, 2024

Week Ahead: Putting Market Moves in Perspective; Watch...

October 6, 2024

Tech Stocks Sell Off, But AI Shines!

June 1, 2024

S&P 500, Bitcoin & XLK: What the Charts...

May 23, 2025

Stock Market Sell Off: Is the Bull Market...

December 20, 2024

    Stay updated with the latest news, exclusive offers, and special promotions. Sign up now and be the first to know! As a member, you'll receive curated content, insider tips, and invitations to exclusive events. Don't miss out on being part of something special.


    By opting in you agree to receive emails from us and our affiliates. Your information is secure and your privacy is protected.

    Latest

    • Bed Bath & Beyond relaunches with first store in Nashville, plans dozens more

      August 10, 2025
    • The Real Drivers of This Market: AI, Semis & Robotics

      August 10, 2025
    • S&P 500 Breaking Out Again: What This Means for Your Portfolio

      August 10, 2025
    • Sydney Sweeney jeans controversy making advertising great again

      August 10, 2025
    • Nagasaki mayor issues chilling warning on 80th anniversary of atomic bombing

      August 10, 2025
    • Kash Patel celebrates major FBI achievements and record seizures during Trump’s first 200 days in office

      August 10, 2025

    Categories

    • Business (1,330)
    • Politics (4,206)
    • Stocks (1,577)
    • Uncategorized (45)
    • World News (1,323)
    • About us
    • Contact us
    • Privacy Policy
    • Terms & Conditions

    Disclaimer: TheTraderHarbor, its managers, its employees, and assigns (collectively “The Company”) do not make any guarantee or warranty about what is advertised above. Information provided by this website is for research purposes only and should not be considered as personalized financial advice. The Company is not affiliated with, nor does it receive compensation from, any specific security. The Company is not registered or licensed by any governing body in any jurisdiction to give investing advice or provide investment recommendation. Any investments recommended here should be taken into consideration only after consulting with your investment advisor and after reviewing the prospectus or financial statements of the company.

    Copyright © 2025 thetraderharbor.com | All Rights Reserved