The Trader Harbor
  • Business
  • Politics
  • World News
  • Stocks
  • Business
  • Politics
  • World News
  • Stocks

The Trader Harbor

Stocks

Mid-Caps Make a Statement with a Breadth Thrust

by admin January 19, 2025
January 19, 2025
Mid-Caps Make a Statement with a Breadth Thrust

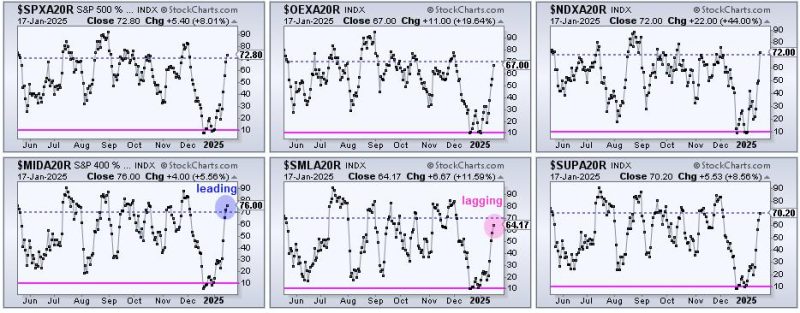
Mid-caps show leadership and were the first to trigger a breadth thrust. Stocks surged this week with mid-caps showing the highest participation rate. Chartists can quantify the participation rate and identify breadth thrusts using the percentage of stocks above their 20-day SMAs. We will analyze these indicators for six broad indexes and show the breadth thrust for the S&P MidCap 400.

Chart Link

The CandleGlance charts above show the percentage of stocks above their 20-day SMAs for the S&P 500, S&P 100, Nasdaq 100, S&P MidCap 400, S&P SmallCap 600 and S&P 1500. We can identify the leaders and the laggards by comparing values. Mid-caps are leading as S&P MidCap 400 Percent Above 20-day SMA ($MIDA20R) surged to 76 percent (blue circle), the highest of the six. This means 76 percent of its component stocks are above their 20-day SMAs. This is a big change because this number was below 10% in mid December. Small-caps are lagging as $SMLA20R finished at 64.17 percent (pink circle). Everything else is in between.

Chart Link

The chart above shows S&P MidCap 400 Percent Above 20-day SMA ($MIDA20R) in the top window with the oversold line at 10 percent (pink) and the thrust line at 70 percent (blue). This indicator formed a bullish divergence and then triggered a breadth thrust on Thursday. A move below 10 percent marks a downside extreme that signals an oversold condition (pink shading). Stocks, however, can become oversold, and remain oversold. Therefore, we need to wait for an upside catalyst. A subsequent move above 70% (blue dashed lines) shows a participation thrust, which means the vast majority of component stocks participated in this advance. Broad participation is bullish. $MIDA20R was the first of the six to cross above 70 percent.

At TrendInvestorPro, we pointed out oversold breadth in December and featured the divergence in Tuesday’s report. A divergence forms when the underlying index ETF (MDY) forges lower lows and the indicator forms higher lows (blue lines). MDY fell from mid December to mid January (lower lows), but fewer stocks within the index moved below their 20-day SMAs during this timeframe. Put another way, more stocks held above their 20-day SMAs. Divergences in March and October 2023 also preceded breadth thrusts.

This week at TrendInvestorPro we covered six Market Regime charts on Wednesday and highlighted seven leading ETFs om Friday’s report/video. Leadership is coming from the middle of the market, and specifically from three sectors. Click here to take a trial and get immediate access.

/////////////////////////////////////////////////

0
FacebookTwitterGoogle +Pinterest
previous post
Only One Group Has Shown Consistent Relative Strength For The Past Year
next post
DOJ sues Walgreens, alleging it ‘knowingly’ filled millions of invalid prescriptions

Related Posts

This Precious Metal is On the Verge of...

March 27, 2025

S&P 500 Approaches 100-Day Moving Average: Is Now...

April 21, 2024

July Strength, Late-Summer Caution: 3 Charts to Watch

July 19, 2025

S&P 500 Above 5400: Economic Optimism or Irrational...

June 14, 2024

Equity “Go” Trend Sees Surge in Strength as...

November 12, 2024

Bullish or Bearish? The Truth About Rate Cuts...

September 21, 2024

How to Find Compelling Charts in Every Sector

July 11, 2025

Bullish AND Bearish Options Trade Ideas

January 14, 2025

S&P 500 Makes a New All-Time High By...

April 29, 2024

S&P 500 Flashes Major Topping Signals

April 17, 2024

    Stay updated with the latest news, exclusive offers, and special promotions. Sign up now and be the first to know! As a member, you'll receive curated content, insider tips, and invitations to exclusive events. Don't miss out on being part of something special.


    By opting in you agree to receive emails from us and our affiliates. Your information is secure and your privacy is protected.

    Latest

    • The Real Drivers of This Market: AI, Semis & Robotics

      July 21, 2025
    • What Musk’s fracture with Trump means for GOP’s future: ‘Beating heart of the Republican Party’

      July 21, 2025
    • Trump’s housing chief rips Powell for blowing millions on Fed facelift during housing crisis he perpetuates

      July 21, 2025
    • Trump celebrates 6 months back in office: US ‘totally revived’ after being ‘DEAD’ under Biden

      July 21, 2025
    • Biden admin spent hefty sum of US tax dollars to upgrade embassy swimming pools in Iraq, Russia

      July 21, 2025
    • Trump heads to Scotland, continues ironing out trade deals after notching six months back in office

      July 21, 2025

    Categories

    • Business (1,299)
    • Politics (4,040)
    • Stocks (1,535)
    • Uncategorized (45)
    • World News (1,292)
    • About us
    • Contact us
    • Privacy Policy
    • Terms & Conditions

    Disclaimer: TheTraderHarbor, its managers, its employees, and assigns (collectively “The Company”) do not make any guarantee or warranty about what is advertised above. Information provided by this website is for research purposes only and should not be considered as personalized financial advice. The Company is not affiliated with, nor does it receive compensation from, any specific security. The Company is not registered or licensed by any governing body in any jurisdiction to give investing advice or provide investment recommendation. Any investments recommended here should be taken into consideration only after consulting with your investment advisor and after reviewing the prospectus or financial statements of the company.

    Copyright © 2025 thetraderharbor.com | All Rights Reserved