The Trader Harbor
  • Business
  • Politics
  • World News
  • Stocks
  • Business
  • Politics
  • World News
  • Stocks

The Trader Harbor

Stocks

Market Pullbacks Provide Opportunities to Build your WatchList – Here’s How

by admin January 12, 2025
January 12, 2025
Market Pullbacks Provide Opportunities to Build your WatchList – Here’s How

The stock market is in pullback mode with the S&P 500 EW ETF down 5.15% over the past month and down 1% year-to-date. This makes it a good time to monitor relative performance and create a relative strength watch list. Stocks and ETFs holding up best during pullbacks often lead when the market regains its footing. Today’s report will show a starter list and analyze the chart for an AI Robotics ETF.

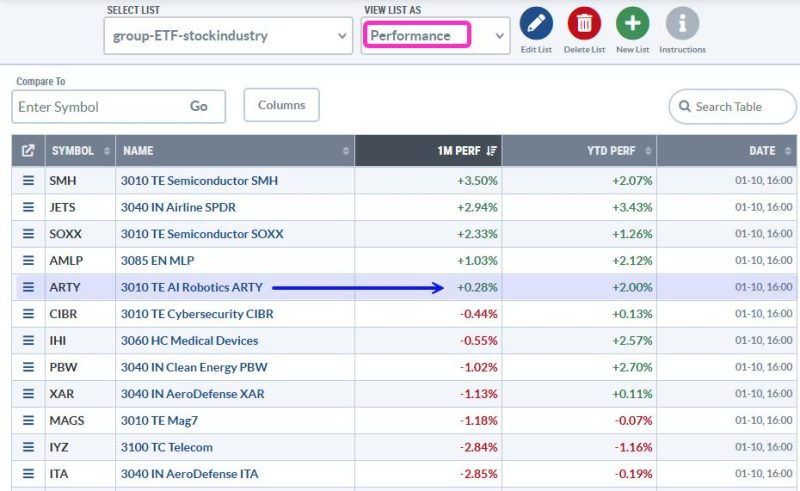
The table below shows 1-month and year-to-date performance for a selection of industry group ETFs. With the S&P 500 EW ETF down on both timeframes, ETFs with gains are holding up well and ETFs with smaller losses show relative strength (less weakness). Five ETFs are up on both timeframes and holding up well in the face of broad market weakness.

Note that this list is simply the first cut. I would make a further cut by insuring that the ETF is in a long-term uptrend. For example, the Clean Energy ETF (PBW) is below its 200-day SMA and would not make the cut. The Medical Devices ETF (IHI) and Robotics AI ETF (ARTY) are in long-term uptrends, and make the cut. Let’s look at ARTY. A recent Chart Trader report/video highlighted the recent breakout in IHI.

The chart below shows ARTY hitting a new high in early December and price above the rising 200-day SMA. ARTY is in a long-term uptrend. There was a big breakout in mid October, an oversold reading in late October and then a 17% run to new highs. ARTY then formed a pennant and broke out with a surge earlier this week, only to fall back the last three days. Overall, I think the pennant breakout is still bullish and this is a throwback to the breakout zone. A break below the pennant lows would negate this pattern and argue for a deeper correction.

Chart Link

The middle window shows the price-relative (ARTY/RSP Ratio) breaking above its 200-day SMA in late November. ARTY shows relative strength and the price-relative hit a new high in early January. The lower window shows %B, which I use to identify oversold conditions within an uptrend. A dip below 0 means the close is below the lower Bollinger Band. This means there was a pullback within the uptrend, which is an opportunity.

I will be following ARTY and other leading ETFs closely in the Chart Trader reports and videos. Our reports warned of the breakout in the 10-yr Treasury Yield in before Christmas (HERE) and we also showed how to distinguish between a robust bounce and a dead cat bounce (HERE).

Click here to take Chart Trader trial and get immediate access.

//////////////////////////////////////////////////

0
FacebookTwitterGoogle +Pinterest
previous post
Don’t worry. There is a common sense response to the surgeon general’s alcohol and cancer warning
next post
S&P 500 Breakdown Alert! Downside Targets Explained

Related Posts

How ADX Stage Analysis Can Make You a...

August 15, 2024

Become the Investor You Aspire to Be: Essential...

May 22, 2025

Why This S&P Support Level is SO IMPORTANT

October 11, 2024

S&P 500 Bullish Patterns: Are Higher Highs Ahead?

June 6, 2025

FINANCIALS BEGIN TO OUTPERFORM AS EQUITY “GO” TREND...

July 23, 2024

XLF’s Record Highs: Buy the Dip or Bail...

February 1, 2025

A Déjà Vu in The Consumer Staples Sector...

September 13, 2024

Here’s Why the Small Cap IWM Will Soar...

November 28, 2024

Sector Rotation & Seasonality: What’s Driving the Market...

March 3, 2025

Can the S&P 500 Rally Without Tech?

December 4, 2024

    Stay updated with the latest news, exclusive offers, and special promotions. Sign up now and be the first to know! As a member, you'll receive curated content, insider tips, and invitations to exclusive events. Don't miss out on being part of something special.


    By opting in you agree to receive emails from us and our affiliates. Your information is secure and your privacy is protected.

    Latest

    • The Real Drivers of This Market: AI, Semis & Robotics

      July 21, 2025
    • What Musk’s fracture with Trump means for GOP’s future: ‘Beating heart of the Republican Party’

      July 21, 2025
    • Trump’s housing chief rips Powell for blowing millions on Fed facelift during housing crisis he perpetuates

      July 21, 2025
    • Trump celebrates 6 months back in office: US ‘totally revived’ after being ‘DEAD’ under Biden

      July 21, 2025
    • Biden admin spent hefty sum of US tax dollars to upgrade embassy swimming pools in Iraq, Russia

      July 21, 2025
    • Trump heads to Scotland, continues ironing out trade deals after notching six months back in office

      July 21, 2025

    Categories

    • Business (1,299)
    • Politics (4,040)
    • Stocks (1,535)
    • Uncategorized (45)
    • World News (1,292)
    • About us
    • Contact us
    • Privacy Policy
    • Terms & Conditions

    Disclaimer: TheTraderHarbor, its managers, its employees, and assigns (collectively “The Company”) do not make any guarantee or warranty about what is advertised above. Information provided by this website is for research purposes only and should not be considered as personalized financial advice. The Company is not affiliated with, nor does it receive compensation from, any specific security. The Company is not registered or licensed by any governing body in any jurisdiction to give investing advice or provide investment recommendation. Any investments recommended here should be taken into consideration only after consulting with your investment advisor and after reviewing the prospectus or financial statements of the company.

    Copyright © 2025 thetraderharbor.com | All Rights Reserved