The Trader Harbor
  • Business
  • Politics
  • World News
  • Stocks
  • Business
  • Politics
  • World News
  • Stocks

The Trader Harbor

Stocks

Alibaba Returns to the Scene of the Crime

by admin June 8, 2024
June 8, 2024
Alibaba Returns to the Scene of the Crime

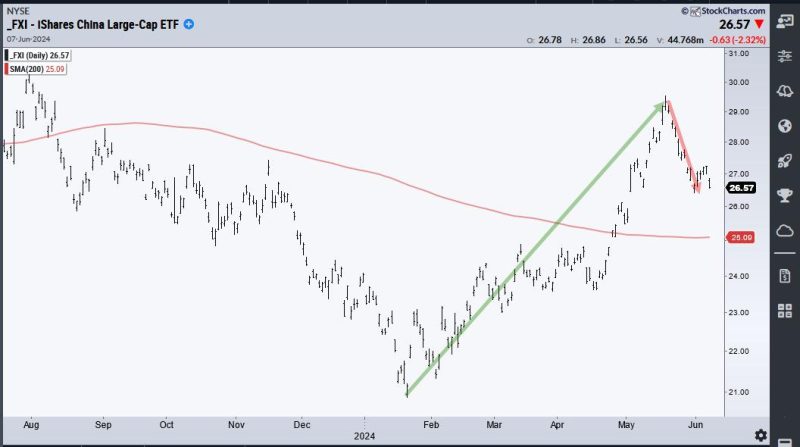
Chinese stocks wet on a tear from mid April to mid May with the China Large-Cap ETF (FXI) gaining some 40% and breaking its 200-day SMA. FXI then fell back over the last few weeks. This surge and pullback created a potential opportunity because some stocks returned to their breakout zones. These so-called throwbacks offer traders a second chance to partake in the breakouts. Today’s example will show Alibaba (BABA), which was featured on ChartTrader this past week.

The chart below shows Alibaba with the 200-day SMA (red line) and the Trend Composite in the indicator window. On the price chart, BABA found support twice in the 67-68 area and broke resistance with a surge in May. The two lows in this area formed a Double Bottom and the breakout reversed the downtrend. Also notice that BABA broke the 200-day SMA.

Traders who did not catch the breakout have a second chance because BABA returned to the breakout zone in early June. This is a classic “throwback” to broken resistance, which turns into support. The stock also returned to the 200-day SMA and the decline retraced around 61.8% of the prior surge. This retracement is normal for a pullback within a bigger uptrend. Overall, I see a Support-Reversal Zone in the upper 70s and I am watching short-term resistance at 80. A breakout here would reverse the short-term downswing and argue for a resumption of the bigger uptrend.

As noted above, the indicator window shows the Trend Composite, which aggregates signals in five trend-following indicators. It moved to +1 in early May, which meant three of the five indicators triggered bullish signals (3 – 2 = +1). Two more indicators turned bullish by the end of May and all five are now bullish (+5). My strategy is to look for tradable pullbacks within bigger uptrends. The Trend Composite signals a long-term uptrend and the decline to the upper 70s is a tradable pullback. Note that this indicator is part of the TIP Indicator Edge Plugin for StockCharts ACP (click here).

ChartTrader at TrendInvestorPro featured BABA and two other Chinese names last week. Recent breakouts in several crypto-related names were also featured because their breakouts signaled a continuation of their bigger uptrends (IBIT, COIN, BLOK). Reports and videos are published twice per week. Click here to learn more.

//////////////////////////////////////////////////

0
FacebookTwitterGoogle +Pinterest
previous post
Rules-Based Money Management – Part 8: Putting Trend-Following to Work
next post
NVIDIA’s Stock Split and Potential Correction

Related Posts

4 Scenarios for Nasdaq 100: Bullish Surge or...

March 18, 2025

What Would a Top in Semiconductors Mean for...

September 2, 2024

Equities Struggle in Strong “NoGo” as Materials try...

April 23, 2024

Why the S&P 500 Won’t Break 6000 (Yet)

October 27, 2024

Here’s Why the Small Cap IWM Will Soar...

November 28, 2024

MEM TV: Is It Safe To Reenter The...

April 6, 2024

Which Top AI Semiconductor Stocks are Positioned for...

January 8, 2025

Master the 18/40 MA Strategy: Spot Trend, Momentum...

May 5, 2025

3 Breakouts Ready for Massive Climbs!

November 17, 2024

UTILITIES TRYING TO “POWER” UP EQUITY MARKETS

June 4, 2024

    Stay updated with the latest news, exclusive offers, and special promotions. Sign up now and be the first to know! As a member, you'll receive curated content, insider tips, and invitations to exclusive events. Don't miss out on being part of something special.


    By opting in you agree to receive emails from us and our affiliates. Your information is secure and your privacy is protected.

    Latest

    • Amazon taps Xbox co-founder to lead new team developing ‘breakthrough’ consumer products

      May 31, 2025
    • U.S. foreign tax bill sends jitters across Wall Street

      May 31, 2025
    • Larry Williams on the Fed, Interest Rates & Markets! What’s Next?

      May 31, 2025
    • Run Your Stock Portfolio Like a Pro Sports Team

      May 31, 2025
    • Leadership Rotation Could Confirm Corrective Phase

      May 31, 2025
    • Breakouts, Momentum & Moving Averages: 10 Must-See Stock Charts Right Now

      May 31, 2025

    Categories

    • Business (1,220)
    • Politics (3,596)
    • Stocks (1,374)
    • Uncategorized (45)
    • World News (1,213)
    • About us
    • Contact us
    • Privacy Policy
    • Terms & Conditions

    Disclaimer: TheTraderHarbor, its managers, its employees, and assigns (collectively “The Company”) do not make any guarantee or warranty about what is advertised above. Information provided by this website is for research purposes only and should not be considered as personalized financial advice. The Company is not affiliated with, nor does it receive compensation from, any specific security. The Company is not registered or licensed by any governing body in any jurisdiction to give investing advice or provide investment recommendation. Any investments recommended here should be taken into consideration only after consulting with your investment advisor and after reviewing the prospectus or financial statements of the company.

    Copyright © 2025 thetraderharbor.com | All Rights Reserved